Try the gtregression 1.1.0 workflow in your browser.
No installation is required and your data does not leave this page
Wait for Ready, then select Run Code in each section, in order. The first load can take a moment while R and the packages start.
The package uses flextable by default for document-ready output. This browser demo requests format = "gt" so the tables can be displayed here. Use gtregression in RStudio for the full default flextable and export experience.
What’s new in 1.1.0
- More regression approaches: the core workflow now supports logistic, Firth logistic, log-binomial, Poisson, robust Poisson, linear and negative binomial regression.
- Survival analysis: dedicated functions support Cox proportional hazards and parametric survival regression, alongside Kaplan–Meier summaries and plots.
- A fuller reporting workflow: use adjusted-variable workflows, model-fit statistics, improved forest plots and publication-ready flextable output.
1. Teaching dataset
The example examines factors associated with low birth weight. First we load gtregression, prepare its teaching dataset and identify the exposures we want to explore.
You now have an analysis-ready dataset with 189 observations and 10 variables. The remaining steps focus on the statistical workflow—not table formatting.
2. Characteristics of the study population
One function produces a grouped descriptive table with an overall column.
3. Explore crude associations
Fit the same univariate logistic-regression model across every exposure. The result is a consistent table that is also ready to plot.
Plot the regression estimates
Create a forest plot
First create and inspect the plotting data.
In RStudio, the next step is simply:
forest_reg(forest_uni)Here is the complete result, rendered with gtregression 1.1.0 in desktop R so the whole forest plot fits comfortably in the browser window.
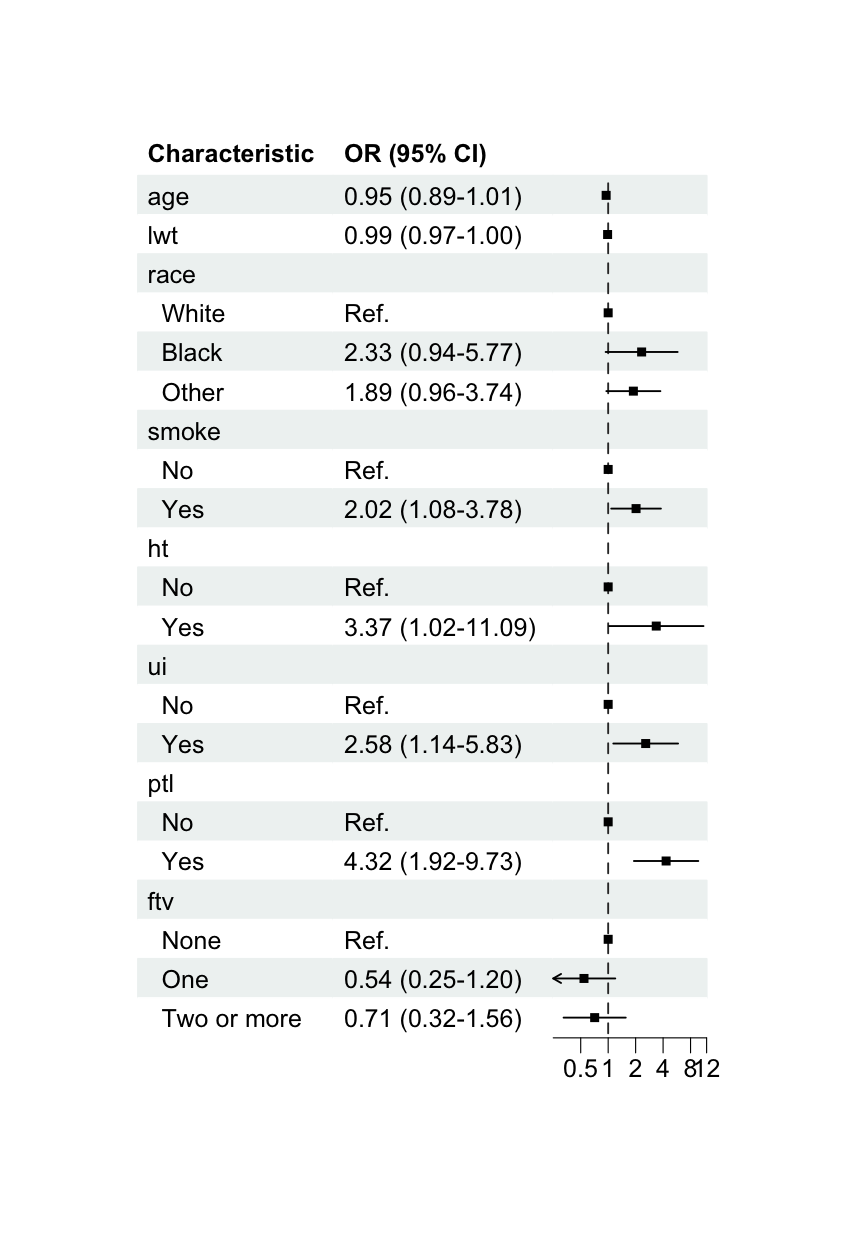
Axis limits, tick marks, labels, column width and exported figure size are easy to customise for your data.
4. Adjust the model
Move from separate crude models to one multivariable model without rebuilding the reporting workflow.
5. Bring everything together
First compare the crude and adjusted estimates in one table.
Combine the complete workflow
First build the combined forest data containing the descriptive, crude and adjusted results.
In RStudio, draw the combined result with:
forest_reg(forest_all)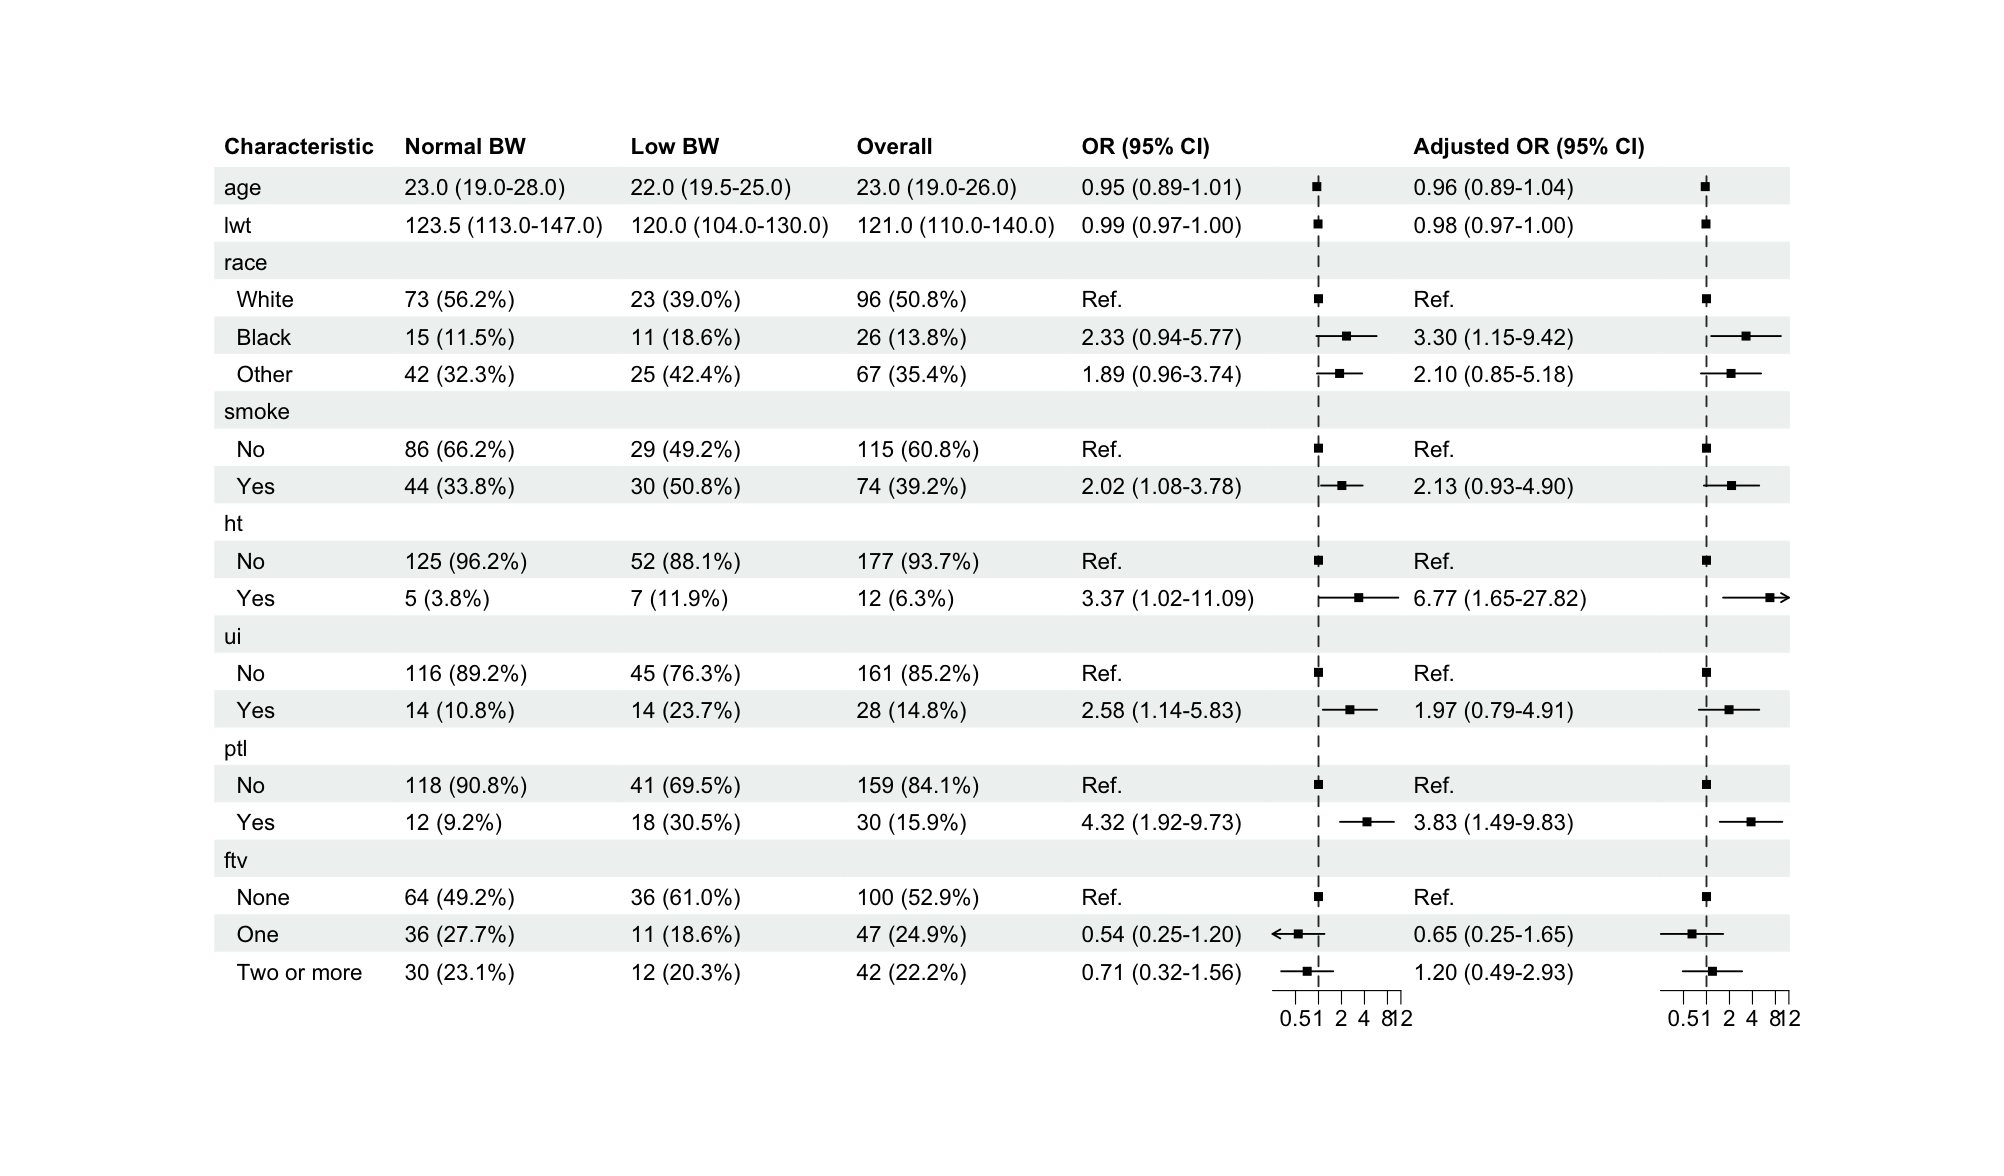
That is the workflow
Data → Descriptive table → Regression → Visualisation
gtregression reduces repetitive reporting code while keeping the statistical decisions visible. The package supports a reproducible workflow; it does not replace thoughtful model specification, diagnostics or interpretation.